Statistics and Probability CT:01
| Created by | Borhan |
|---|---|
| Last edited time | |
| Tag |
Resources:
- Random variable, Probability Mass function & Density function : https://www.youtube.com/watch?v=kkmCFyxRdlI
- Binomial & Poisson distribution : https://www.youtube.com/watch?v=gbqB35_yoo0
- Bernoulli Distribution : https://www.youtube.com/watch?v=wwuhjBoaT_g
- Moments in Statistics: Mean, Variance, Skewness & Kurtosis - Importance and Applications : https://www.youtube.com/watch?v=T_1IJZxFuxw
- Kurtosis : https://www.youtube.com/watch?v=B4o3fI3JnG4 , https://www.youtube.com/watch?v=xc05vFDkw88
Statistics
Basically use it for result finding.
Data Type:
- Ungroup Data
- Group Data
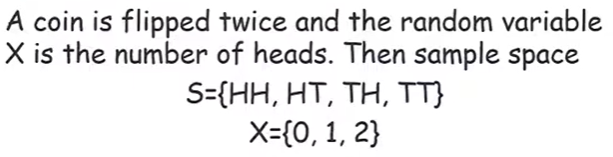
Random Experiment & Random Value:
কোন এক্সপেরিমেন্ট করার টাইমে প্রত্যেক ট্রায়ালে যদি ভিন্ন ভিন্ন আউটকাম আসে, সেইটা একটা র্যান্ডম এক্সপেরিমেন্ট। যেমন একটা কয়েন টসে কখন হেড, কখন টেইল পাওয়া যাবে, তাই এইটা একটা র্যান্ডম এক্সপেরিমেন্ট। এইরকম একটা র্যান্ডম এক্সপেরিমেন্টের প্রত্যেকটা আউটকামকে একটা নিউমেরিক ভ্যালু দিয়ে প্রকাশ করা যায়। এই প্রকাশের জন্য র্যান্ডম ভ্যারিয়েবল ব্যাবহার করা হয়। [Reference]
A random variable is a rule that assigns a numerical value to each outcome in a sample space. [Reference]
Types of Random Variable:
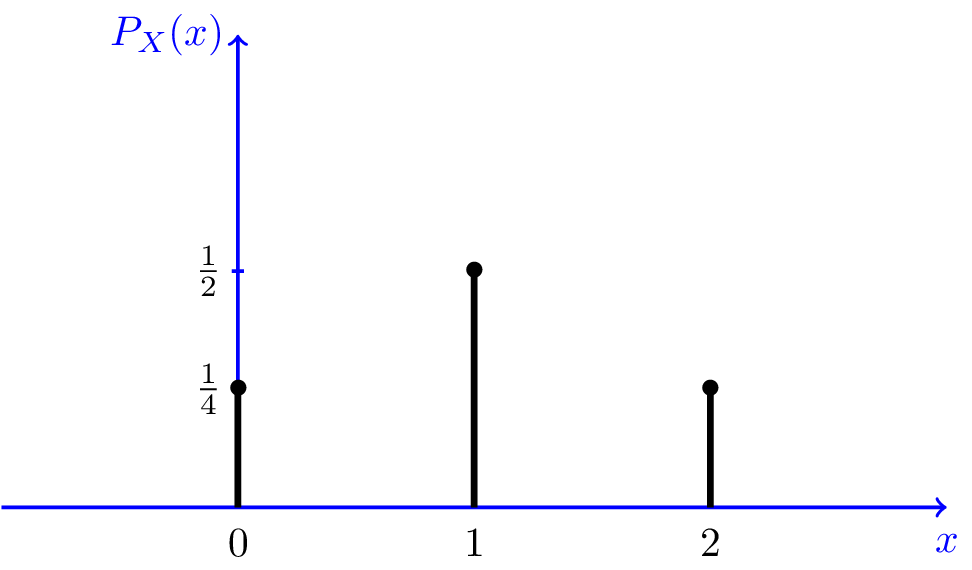
- Discrete Random Variable :
A discrete random variable is one which may take an only a countable number of distinct values. [Ref]
র্যান্ডম ভ্যারিয়েবলের পসিবল ভ্যালুগুলো গণনা করা গেলে, সেইটা discrete random variable বলে। [Ref]
- Continuous Random Variable
যদি কোন র্যান্ডম ভ্যারিয়েবলের ভ্যালু একটা রেঞ্জের মধ্যে যেকোনো একটা ভ্যালু হতে পারে, গণনা করা যায়না, তাইলে সেইটা হবে একটা continuous random variable। [Ref]
A continuous random variable is one which takes an infinite number of possible values. Example : height, weight, the amount of sugar in an orange [Ref]
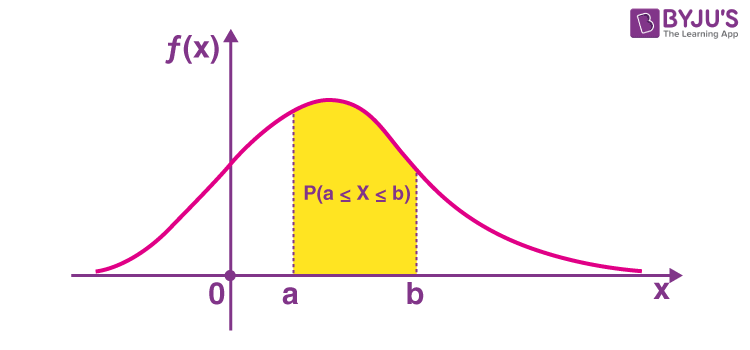
- Probability Density Function (PDF)
Calculate within an interval.
Binomial Distribution
Binomial Experiment: A binomial experiment is an experiment using a fixed number of independent with only two outcomes.
success
number of event
probability of success
probability of unsuccess
Poisson Distribution
When you should use it:
- When the probability is too small, such as 0.001, 0.01, 0.0002..
Bernoulli Distribution
A Bernoulli Distribution is a discrete probability which has only two possible outcomes.
Possible Outcomes:
Success - 1
Failure - 0
Example:
- Coin : Head - Success, Tail - Failure
- Rolling a dice : 6 - Success, 1,2,3,4,5 - Failure
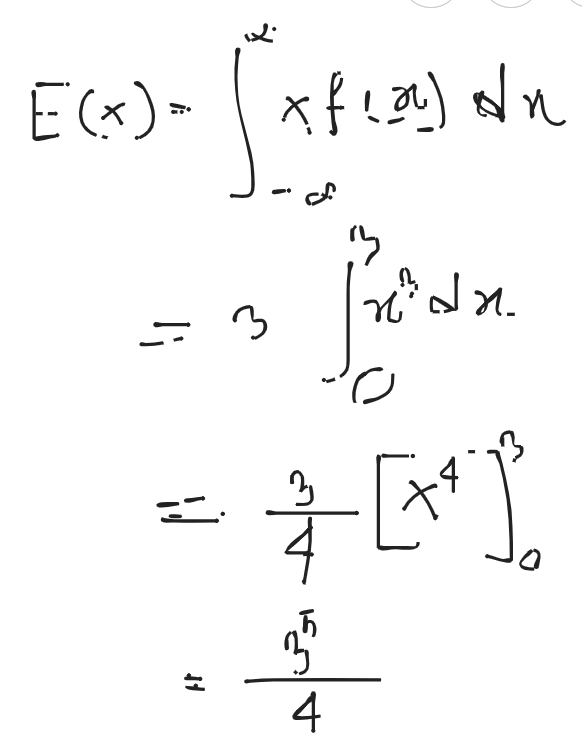
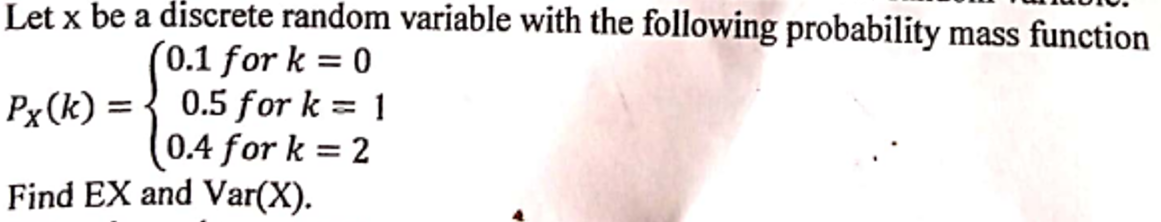
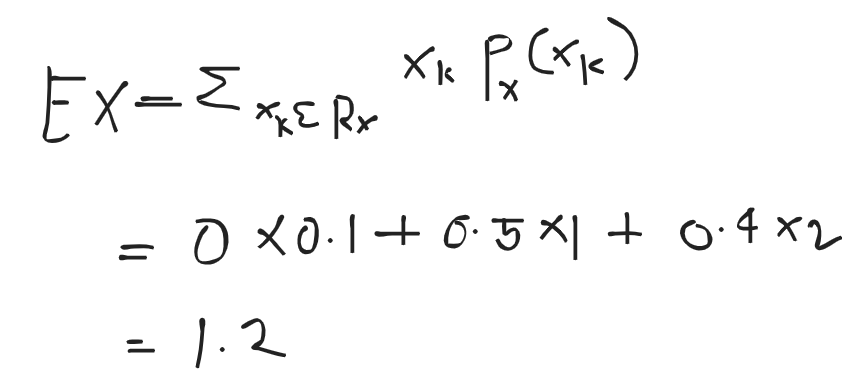
Expected value,
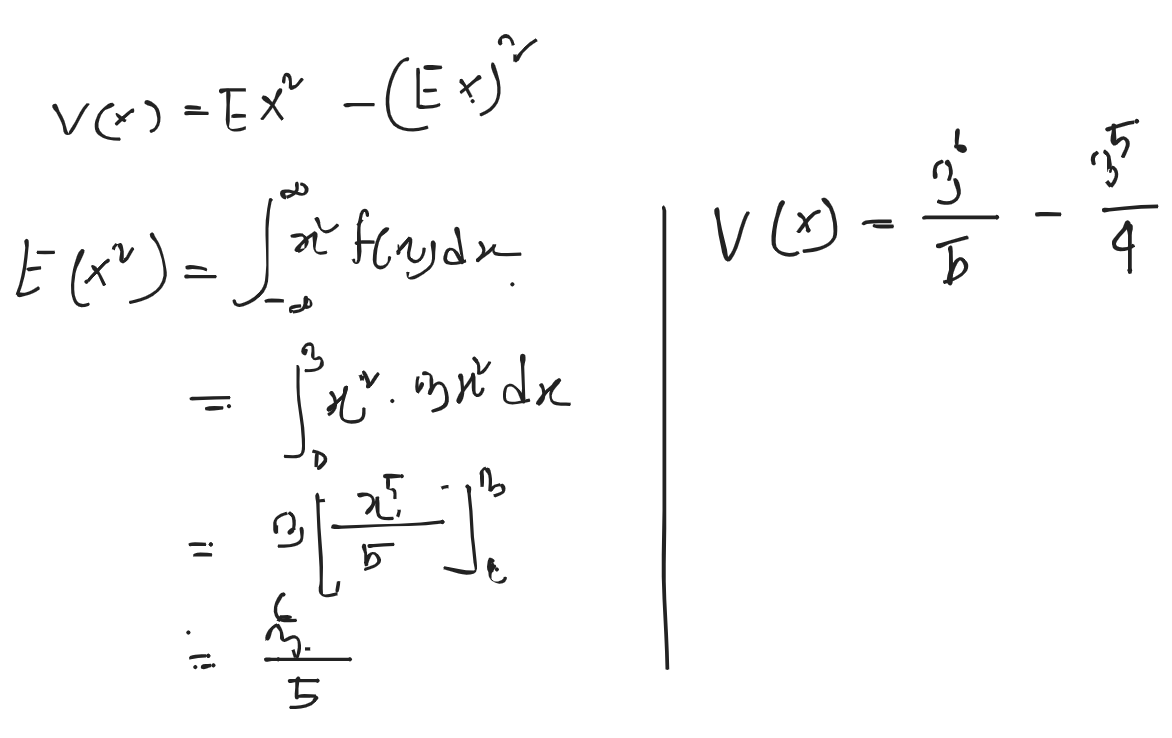
Variance of discrete probability distribution,
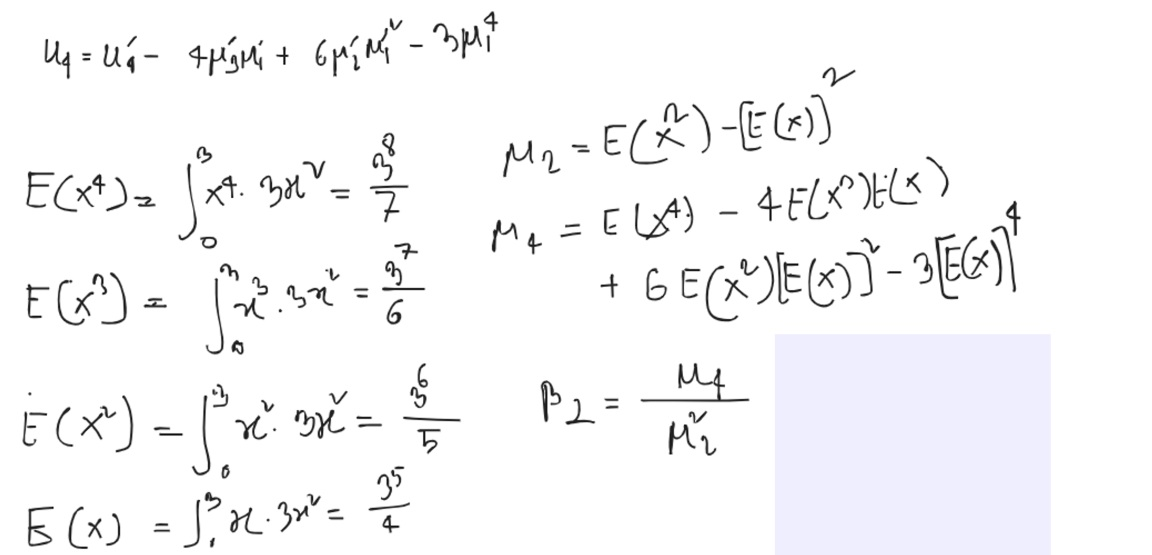
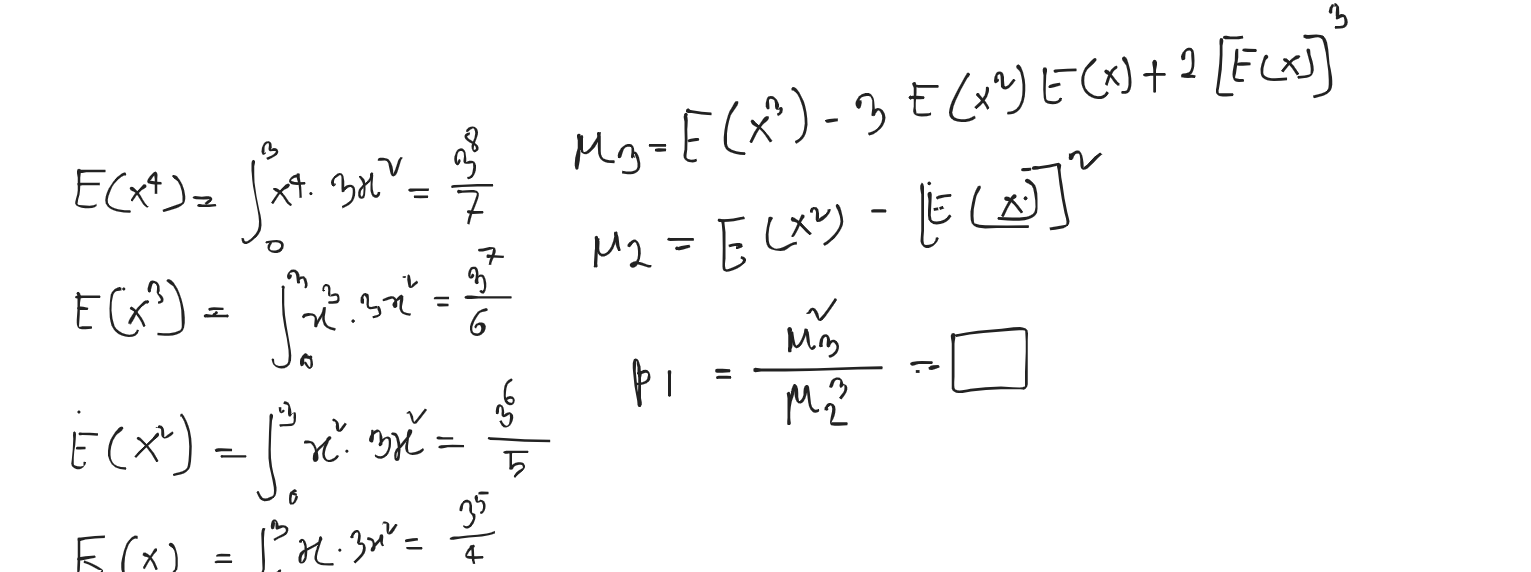
Moment
- Moments are a set of statistical parameters to measure a distribution.
- Moments are helpful to describe the distribution.
- To describe statistical properties of set of points
- To compare different sets of points, or to measure the similarity between two sets of points
- Moments can be useful tool for understanding the relationship between different sets of data
Classifications:
- Raw Moment
, any arbitrary value
- Central Moment
, mean
- Moment about origin
Variance ()
-
- Standard Variance,
Types:
- Mean
-
- Variance
- Variance measures the dispersion or spread of the points around the mean
-
- The square root of the variance is called the standard derivation
- Skewness
- It measures how asymmetric the distribution is about it’s mean.
-
- Symmetrical : if the values to the left and right of the mean are roughly the same
-
- Types:
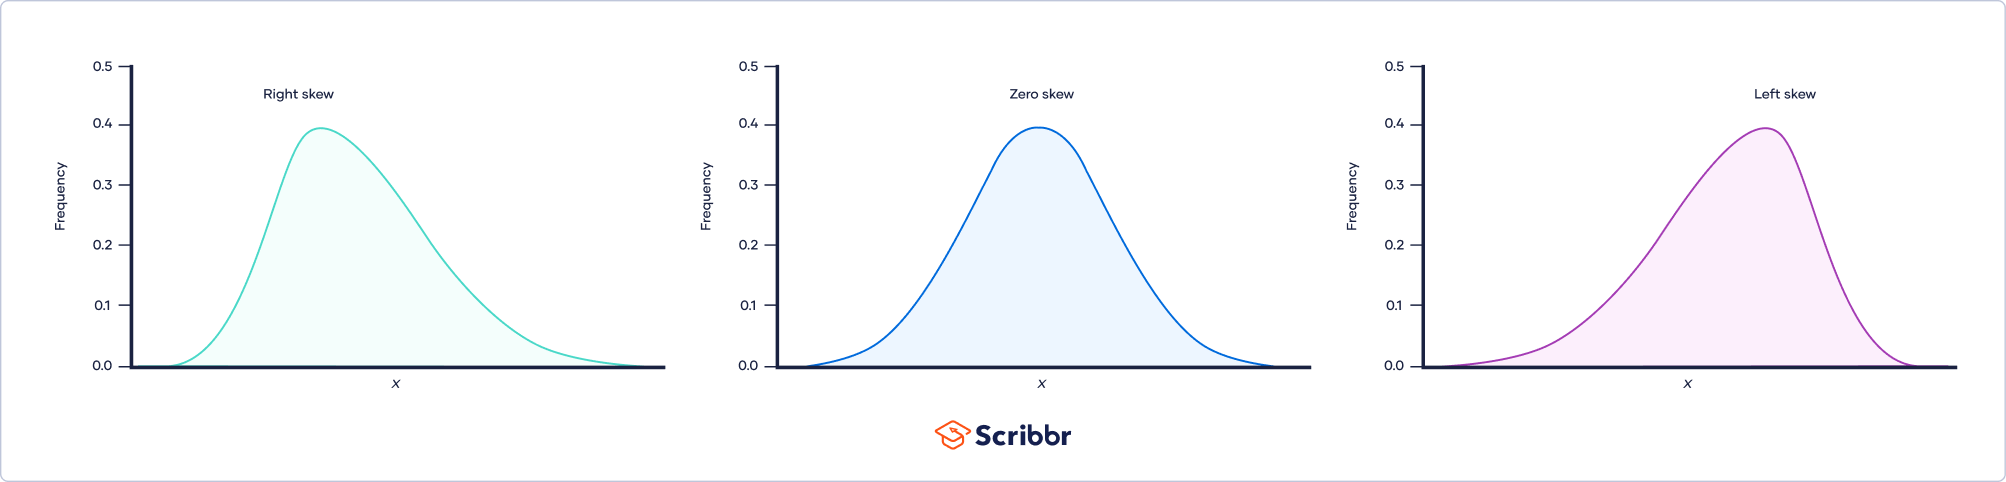
[Ref] - Symmetrical Distribution (No Skewness)
- It’s left and right sides are mirror images
- mean = median
- Positively
- longer on the right side of its peak than on it’s left
- mean > median
- Negatively
- longer on the left side of it’s peak than on its right
- mean < median
- Symmetrical Distribution (No Skewness)
- Kurtosis
- Kurtosis refers to the degree of flatness or peakedness in the region of a curve.
- Types:
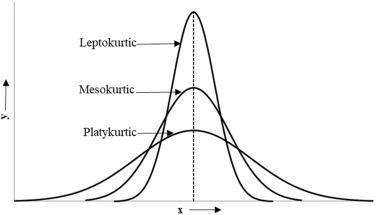
- Platykurtic
- A frequency distribution is said to be platykurtic, when it is flatter than the normal curve.
- Kurtosis: >0.263
-
- Leptokurtic
- A frequency distribution is said to be leptokurtic, when it is more peaked than the normal curve.
- Kurtosis: < 0.263
-
- Properties:
- Positive excess kurtosis
- Slender in shape
- Fatter tails
- Mesokurtic
- A frequency distribution is said to be Mesokurtic, when it almost resembles to the normal curve
- Kurtosis : 0.263
-
- Platykurtic
Question Analysis:
- Difference Between Binomial and Poisson Distribution.
| Binomial | Poisson |
|---|---|
| It is biparametric (Has 2 parameters) | Uniparametric |
| The number of attempts are fixed | The number of attempts are unlimited |
| The probability of success is constant | The probability of success is extremely small |
| There are only two possible outcomes. | There are unlimited possible outcomes. |
| Mean > Variance | Mean = Variance |
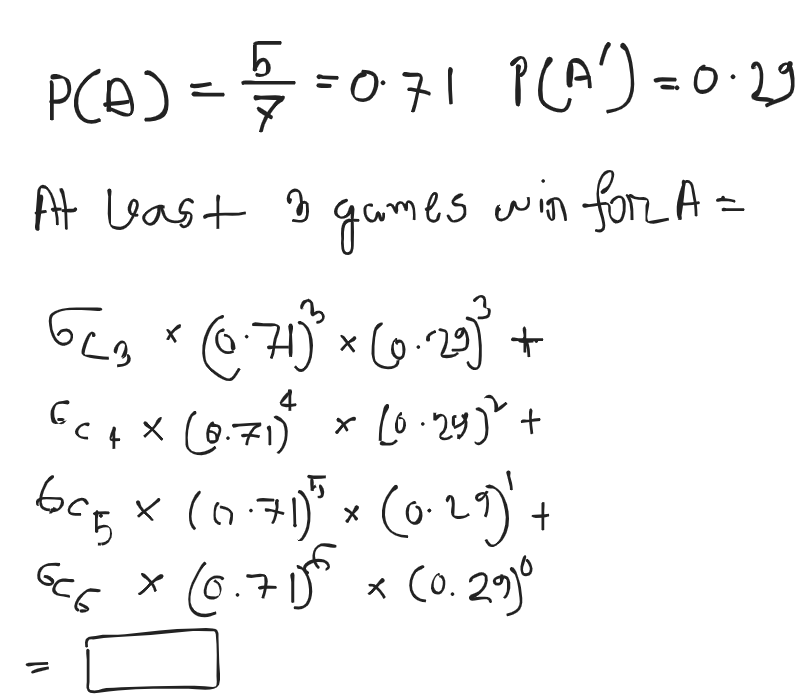
- A and B play a game in which their chances of winning are in the ratio 5:2. Find A's chance of winning at least three games out of six games played.
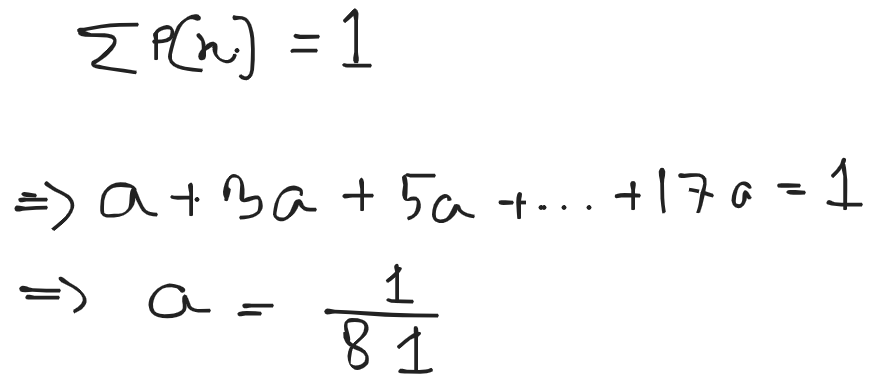
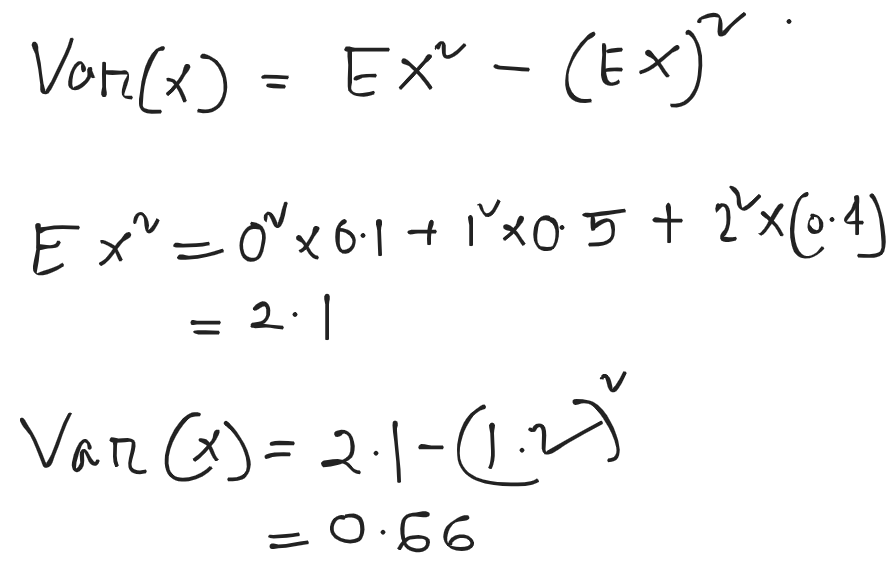
- A random variable X has the following probability distribution :
| Value of x | 0 | 1 | 2 | 3 | 4 | 5 | 6 | 7 | 8 |
|---|---|---|---|---|---|---|---|---|---|
| P(x) | a | 3a | 5a | 7a | 9a | 11a | 13a | 15a | 17a |
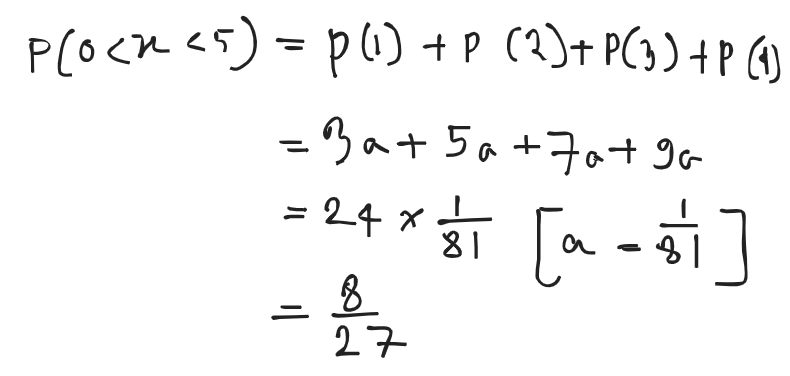
Determine the value of a
Also find
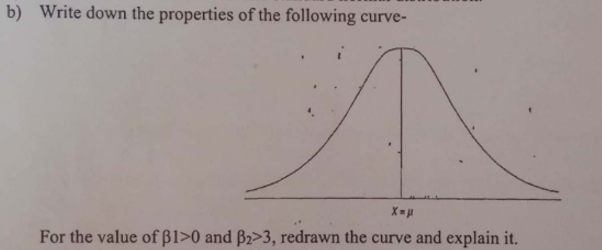
- Define Normal Distribution and Standard Normal Distribution.
The Normal Distribution is defined by the probability density function for a continuous random variable in a system. Let us say, is the probability density function and is the random variable. Hence, it defines a function which is integrated between the range or interval to , giving the probability of random variable , by considering the values between and .
The standard normal distribution (z-distribution) is a special normal distribution, where the mean is 0 and the standard derivation is 1.
, mean
It’s a leptokurtic curve. A frequency distribution is said to be leptokurtic, when it is more peaked than the normal curve.
Properties:
- Excessive positive kurtosis
- Slender in shape
- Flatter tails
- Kurtosis < 0.263
- Describe the area property/properties of normal distribution.
- mean = median = mode
- The total area under the curve should be equal to 1.
- The normally distributed curve should be symmetric at the centre.
- There should be half of the values are to the left of the center and exactly half of the the right.
- The normal distribution curve must have only one peak.
- The curve approaches the x-axis, but it never touches.
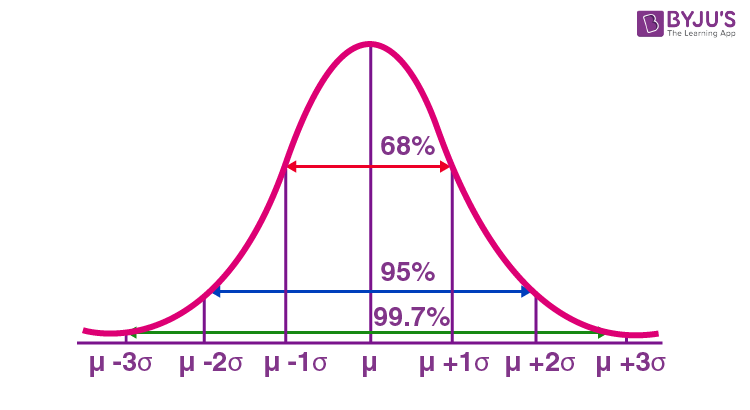
- Approximately 68% of the data falls within
- Approximately 95% of the data falls within
- Approximately 99.7% of the data falls within
- Difference between a discrete random variable and a continuous random variable?
| Discrete random variable | Continuous random variable |
|---|---|
| Has finite number of possible values | could have any value within a certain range |
| Takes countable set of values | Takes on an uncountable set of values |
| Described by PMF | Described PDF |
| P(a ≤ X ≤ b) is meaningful | P(a ≤ X ≤ b) represents the probability of a range |
| Number of students in a class | Height of individuals in a population |
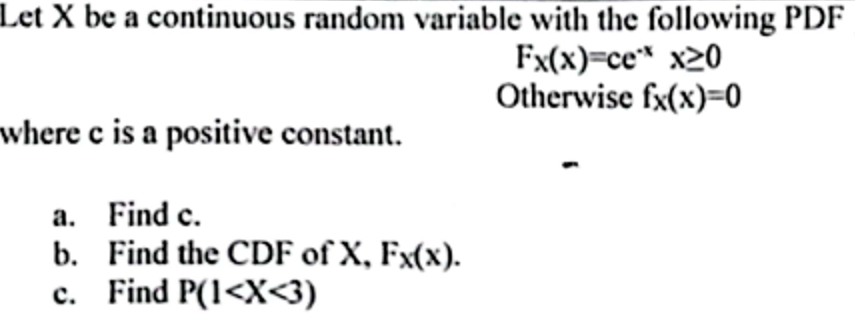
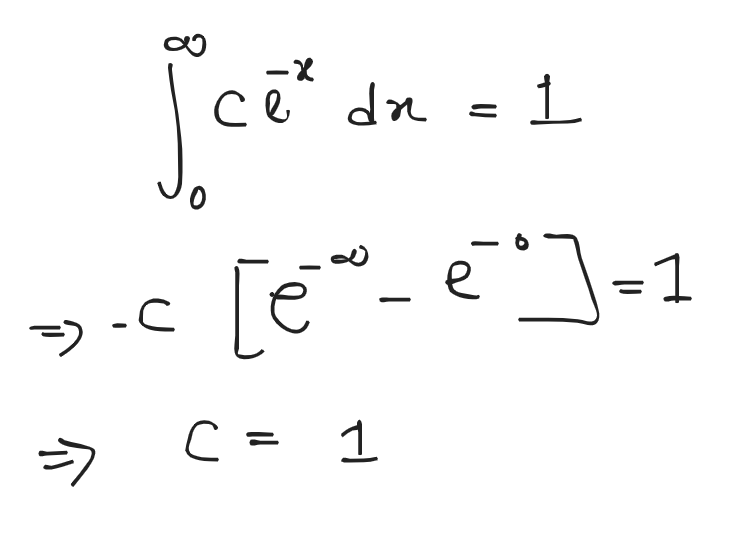
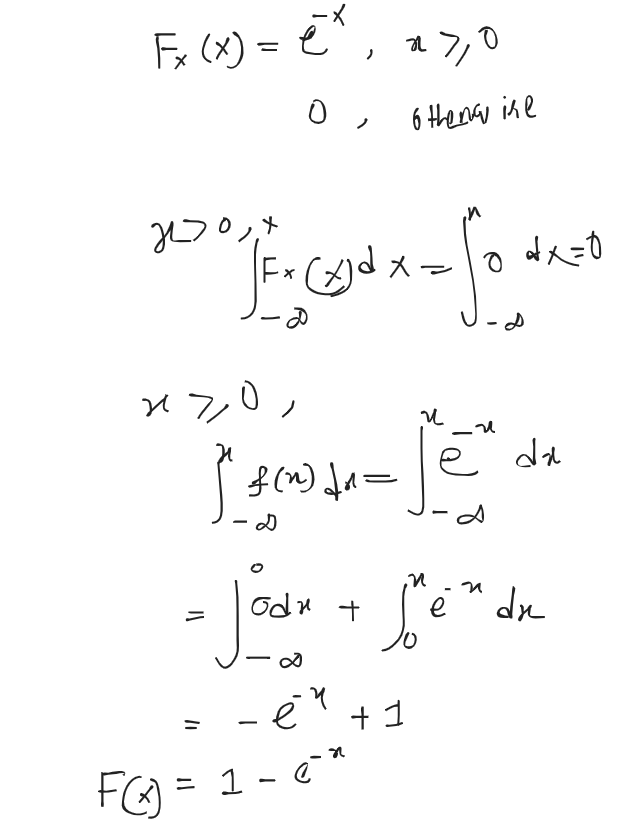
- Write down the probability density function of continuous random variable.
Let be continuous random variable. Then a probability distribution or probability density function (pdf) of is a function such that for any two numbers and with , we have
- Importance of Normal Distribution
- The normal distribution is easy to work with mathematically.
- Many things are actually normally distributed, or very close to it . Such as, height and intelligent are approximately normally distributed; measurement errors also often have a normal distribution.
b)
c)